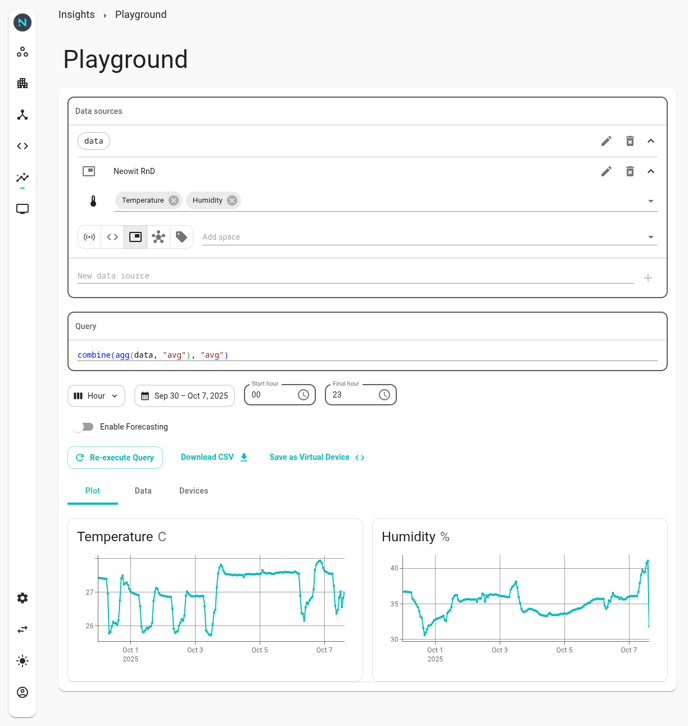
You pick data sources (devices, virtual devices, spaces, integrations or tagged devices), write a one-line query, choose resolution (minutes/hours/days), and set the time window. The Playground then returns exactly the dataset you asked for - ready for charts, exports, or downstream analytics.
You can access the Playground by clicking the button at the bottom of the Insights page:![]()
You can also use the following URL: https://app.neowit.io/insights/playground
How It Works ⚙️
You’ll create one or more data sources listing the sources of sensor data you want. Then you'll write a single line of text, called a query, to specify what we should do with the source data before giving it to you. You will also specify the resolution that you want the resulting data to have and the time period it should cover.
Data sources
To create a new data source, click the “New data source” text field, enter a name of your choosing, e.g. room_4, and press enter. You can now select among different sources of sensor data. These can be specific physical or virtual devices, or groups of devices with the same space, integration or user tag. You can add as many sources as you want. You can also restrict which sensor types you want to include in the data of each source.
Query
The query can be as simple as the name of a data source, which will give you the raw data from the source. But usually you’ll want to do something with the data first, like combining data from different devices. For this, you can use functions. A function consists of a name, like agg, followed by a set of arguments enclosed in parentheses, as in agg(room_4, "avg"). There can be different types of arguments:
- Data sources: Names of data sources defined by you, like
room_4.
- Strings: Text enclosed in double quotes, like
"avg".
- Numbers: Simple numbers, like
123or45.67.
- Lists: A list of items in square brackets, like
[room_4, room_5]. The items could be of any type.
- Functions: The output of one function, like
agg(room_4, "avg"), can be used as an argument in another function, as incombine(agg(room_4, "avg"), "avg").
You will find a list of available functions and their arguments below.
Queries can also include operators, which are symbols that can be used for doing arithmetic (e.g. +, -, *, /) and comparisons (e.g. >, <). The two most common uses of operators are simple number arithmetic (like converting hours to seconds) and thresholding (like using people_count > 0 to produce a value of 1 whenever someone is present and 0 otherwise, or temperature > 0.0 to produce a value of 1 when your freezer is broken and 0 when not).
Resolution
You can choose which time resolution (e.g. minutes, hours, days) you want for the data returned to you. This resolution will be used by the functions in your query that change the resolution of the input data, like agg. If your query does not contain any such functions, the data will automatically be converted to this resolution before you obtain it.
Time period
You can adjust the first and last date and time of day for the output data. If you request a long time period, you may have to switch to a coarser resolution, otherwise there would be too much data to return.
Common Functions 🛠️
These are the main tools you'll use to build your queries.
agg(data, method, fillna)
Aggregates (downsamples) data over time for each series individually. It's useful for changing the resolution of your data, like turning one-second data points into one-hour averages. It works like this: each time series in the input data gets divided into multiple intervals based on your selected output resolution. So if the output resolution is one hour, each interval will be one hour long. Then all values that fall into the same interval are combined using the specified aggregation method, and the result becomes the value for that time interval in the output series.
data: The data you want to aggregate, usually specified as a data source.method: The aggregation method. Must be one of the following strings:"avg","sum","max","min","lastValue"or"auto"(see explanations further down).fillna: Optional, assumedfalseby default. Usetrueto fill in missing data gaps by repeating the previous value before aggregating.
Note
If the output resolution is higher than the resolution the data is stored at, this function will do nothing.
Example
You have defined a data source people_count_device containing a device with people count data, and selected an output resolution of one minute. agg(people_count_device, "max") will give you the maximum number of people for each hour that the sensor reported a people count. agg(people_count_device, "max", true) (that is, enabling the fillna option) will fill in missing counts with the previous count before aggregating (effectively assuming that the people count will stay the same until a new count is reported), giving you the maximum number of people for every hour.
Take a look at the following figures for an illustration of how aggregation works.
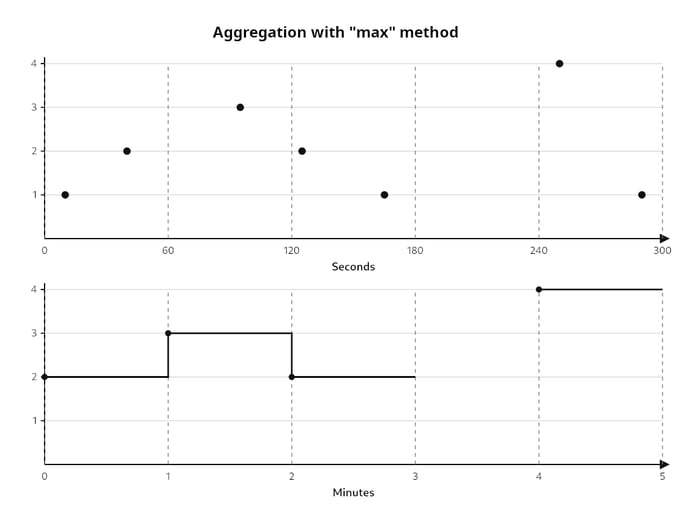
In the above figure, we are aggregating some irregularly spaced data points from second resolution (top) to minute resolution (bottom). The data points inside each whole minute interval are merged using the selected method. In this case, we are taking the maximum. The merged value is then used as the value for that minute in the output time series. Notice that there is no output value for minute 3. This is because the input series does not have any data points in the interval from minute 3 to 4, and we are not filling in missing values.
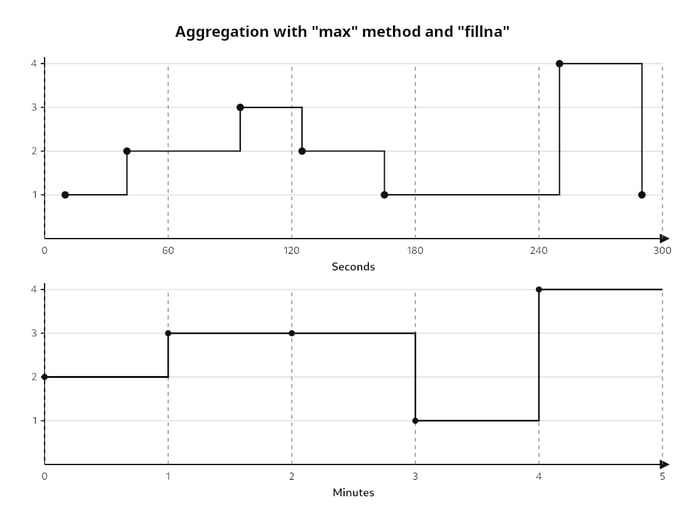
This figure shows the same situation with the same data points, but now we have enabled the fillna argument to fill in a value for every single second by repeating the latest data point. Notice that the value for minute 2 has increased because the value for the previous data point has extended into this minute. Similarly, because the last data point in minute 2 extends into minute 3, we are no longer missing the value for minute 3.
avg(data, fillna)
Aggregates the data over time by averaging. Shorthand for agg(data, "avg", fillna).
sum(data, fillna)
Aggregates the data over time by summing. Shorthand for agg(data, "sum", fillna).
max(data, fillna)
Aggregates the data over time by taking the maximum. Shorthand for agg(data, "max", fillna).
min(data, fillna)
Aggregates the data over time by taking the minimum. Shorthand for agg(data, "min", fillna).
combine(data, method, fillna, neverFillEmptyRows)
Combines data from multiple devices into a single series for each sensor type. The output is effectively a new device containing the combined data series. It's useful for getting an overall picture, like the average temperature across all devices in a room.
data: The data you want to combine, usually specified as a data source containing multiple devices or a function (likeagg) that returns data for multiple devices. It could also be a list of multiple data sources or functions.method: The aggregation method to use when combining the values from different devices. Must be one of the following strings:"avg","sum","max","min","lastValue"or"auto"(see explanations further down).fillna: Optional, assumedfalseby default. Usetrueto fill in missing data gaps by repeating the previous values before combining.neverFillEmptyRows: Optional, assumedfalseby default. When thefillnaoption is enabled, this can be set totrueto avoid filling in missing data at times when none of the devices reported a value. You should set it totrueif you are combining an expression containing thelingerfunction, otherwise leave itfalse.
Example
You have defined a data source temp_devices containing multiple devices that report a temperature every whole minute. combine(temp_devices, "avg") will give you the average of the temperatures reported by the devices every minute. But what if the devices reported their readings at different times during each minute? To combine values from different sensors, they must be known at the same exact time, so we would have to aggregate the data to “line up” the values before combining them: combine(agg(temp_devices, "avg"), "avg").
reduce(data, method, fillna)
Reduces data by aggregating values that fall into the same relative time position within repeating larger time intervals. In simpler terms, it lets you compare or summarize how each day (or hour, or minute, etc.) behaves across multiple larger periods — like averaging all Mondays together, or finding the maximum temperature recorded between 14:00 and 15:00 across many days.
Here’s how it works: the time series is divided into bins according to the output resolution (for example, one bin per day if the output resolution is “Day”). These bins are then grouped into larger time spans corresponding to the next coarser resolution — for instance, into weeks if your output resolution is daily, or into days if your resolution is hourly. Each bin in the same relative position across groups (like all Mondays) is combined using the chosen aggregation method. The result is a new time series encompassing the last group of bins, where the value for each bin is the aggregated value for that position across all groups.
This is useful for identifying repeating patterns or typical behavior within a cycle, such as the average daily temperature profile, average occupancy per weekday, or total energy use for each hour of the day.
Similarly to agg, the reduction is performed for each series individually.
data: The data you want to reduce, usually specified as a data source.method: The aggregation method to use when merging the values for each bin. Must be one of the following strings:"avg","sum","max","min","lastValue"or"auto"(see explanations further down).fillna: Optional, assumedfalseby default. Usetrueto fill in missing data gaps by repeating the previous values before reducing.
Example
You have defined a data source energy_usage containing a device with energy usage data, selected an output resolution of one day, and configured the time period to last from January 1st to March 31st 2025. reduce(energy_usage, "avg") will give you the average value for each day of the week during that period, combining all Mondays together, all Tuesdays together, and so on. The output time series will span the last seven days of the period, from Tuesday 25th to Monday 31st, and contain the aggregated values. So the first output value will be the average value for all Tuesdays, while the last output value will be the average value for all Mondays.
clipday(data, startTime, endTime)
Restricts your data to a specific time window within a day.
⚠️ Warning: This function operates in UTC time only.
data: The data you want to restrict, usually specified as a data source.startTime/endTime: The start and end times in seconds from midnight (e.g., 09:00 is9*60*60=32400).
Exampleclipday(room_4, 8*60*60, 18*60*60) clips the data to the hours between 08:00 and 18:00 UTC.
weekdays(data, dayIndices)
Filters your data to only include specific days of the week.
⚠️ Warning: This function operates in UTC time only.
data: The data you want to filter, usually specified as a data source.dayIndices: A list of numbers for which weekdays to include, where Monday is0and Sunday is6.
Exampleweekdays(room_4, [0, 1, 2, 3, 4]) filters for data from Monday to Friday.
Aggregation Methods
When using agg, combine or reduce, you need to specify how to combine the data points.
"avg": The average value."sum": The sum of the values."max": The highest value."min": The lowest value."lastValue": The most recent value."auto": We try to select a suitable method automatically based on the kind of data.
Rules of Thumb 👍
Writing queries is a powerful tool for obtaining exactly the data you want in the form you want. But this flexibility also leaves a lot of room for mistakes. Here are some rules of thumb that will help you avoid some common mistakes.
Always aggregate
The time series data you can query is always stored in a specific resolution (data from physical devices is typically stored in second resolution, while data from virtual devices could be stored in any resolution). Since you can specify any resolution when you perform a query, the data typically has to be aggregated (or interpolated) to convert it to the resolution you request. This will happen even if you are not using the agg function in your query. In effect, all queries are implicitly wrapped in an agg(<your query>, "auto"). The aggregation method is chosen automatically based on the units of the data. But this may not always be what you want. To avoid surprises, it is safest to always use agg explicitly on your data source and specify the appropriate aggregation method for the data in question.
Which aggregation method to use?
Here are the methods you will most likely want to use for the agg and reduce functions based on the type of data you are aggregating. But bear in mind that there are cases where different aggregation methods would be more appropriate.
For sensors whose output data varies continuously, like temperature, pressure, humidity and CO2, use the "avg" method and omit or pass false as the fillna argument. Rationale: When talking about the temperature for a particular hour, we typically mean the average of the temperature measurements during that hour.
For sensors that intermittently report a discrete state, like people count and presence, use the "max" method and pass true as the fillna argument. Rationale: Taking the maximum gives us the most significant state during each time interval. Since each state lasts until a new state is reported, filling in missing values with the previous reported value is appropriate.
For sensors that report counting events, like certain line crossing sensors, use the "sum" method and omit or pass false as the fillna argument. Rationale: Each event contributes with a count, so to obtain the total count during some time interval we need to sum the counts reported during that interval. Filling in missing values would repeat events and thus lead to a wrong count.
Aggregate before combining devices
When you use combine without fillna to merge data from multiple devices, what happens is that for each point in time, the data points from all the devices that have a data point for the sensor type in question at that time are combined with the specified method. If the data points of the different devices do not line up in time, each combined point will typically only contain contributions from one or a few of the devices. This is probably not what you want. To make sure the data points line up, use agg before combining to confine the data points to consistent times for all the devices.
Note: You can safely use reduce inside combine without wrapping the reduce in agg, since the output of reduce always will be aligned.
Which combination method to use?
Here are the methods you will most likely want to use for the combine function based on the type of data you are aggregating. But bear in mind that there are many cases where different combination methods would be more appropriate.
If you have aggregated the input data as recommended, you can always omit or pass false as the fillna argument to combine. When filling in missing values is needed, you will already have done that with agg.
For sensors whose output data varies continuously, like temperature, pressure, humidity and CO2, use the "avg" method. Rationale: When multiple devices report a temperature, we often (but not always) want their average.
For sensors that report a binary (true/false) state, like presence sensors, use the "max" method. Rationale: Whenever any of the devices report true (1), the output will be true. If multiple desk sensors in a room report a positive presence, we probably want to report a positive presence for the room as a whole.
For sensors that report counts for non-overlapping spaces, like people count sensors for multiple rooms, use the "sum" method. Rationale: We often want a total count. If the sensors cover completely separate spaces, there is no double counting, so summing the separate counts will be correct.
For sensors that report counts for overlapping spaces, like people count sensors in the same open area, use the "max" method. Rationale: Multiple sensors may be counting the same person. Taking the maximum count selects the sensor that has the best overview and thus gives the best estimate for the count in the space.
Putting It All Together: Examples 💡
Example 1: Average daily temperature from a device
agg(device, "avg")
Here, device is a data source containing the physical device, restricted to the “Temperature” sensor type. Set resolution to “Day”.
Explanation: The agg function with the "avg" method will determine the average temperature reported by the device during each daily interval.
Equivalent shorthand: avg(device)
Example 2: Average daily temperature from a device during work hours (UTC+2)
agg(weekdays(clipday(device, (8-2)*60*60, (16-2)*60*60), [0,1,2,3,4]), "avg")
Here, device is a data source containing the physical device, restricted to the “Temperature” sensor type. Set resolution to “Day”.
Explanation: The clipday function will keep only the data reported between 08:00 and 16:00 UTC+2, which is between (8-2)*60*60 and (16-2)*60*60 seconds since midnight UTC time. The weekdays function will take that data and only keep the values reported for Monday through Friday (weekdays 0, 1, 2, 3 and 4). Since the function operates in UTC time, the transition between days will be at 02:00 UTC+2 rather than at local midnight time, but this doesn’t matter in our case because we are only including work hours. The agg function with the "avg" method will then determine the average temperature reported by the device during work hours for each daily interval, excluding Saturdays and Sundays.
Example 3: People count from a device every hour
agg(device, "max", true)
Here, device is a data source containing the physical device, restricted to the “People Count” sensor type. Set resolution to “Hour”.
Explanation: The agg function with the "max" method will determine the maximum people count reported by the device during each hourly interval. The true argument enables the fillna option, which fills in the last reported people count for hours where no people count was reported. This prevents gaps in the output data.
Equivalent shorthand: max(device, true)
Example 4: Total people in/out of office every hour
agg(line_crossing_device, "sum")
Here, line_crossing_device is a data source containing the physical device reporting line crossing events for the office entry, restricted to the “People count (going in) event” and “People count (going out) event” sensor types. Set resolution to “Hour”.
Explanation: The device will report line crossing events specifying the number of people entered or exited the office during a given time interval. The agg function with the "sum" method will sum up the counts from all such events during each hourly interval. Note that enabling fillna here (passing true as a third argument) would lead events to be duplicated and thus produce the wrong results.
Equivalent shorthand: sum(device)
Example 5: People count in a room every hour
combine(agg(room, "max", true), "max")
Here, room is a data source containing the space representing your room, restricted to the “People Count” sensor type. Set resolution to “Hour”.
Explanation: The agg function with the "max" method will determine the maximum people count reported by each device in the room during each hourly interval. The true argument enables the fillna option, which fills in the last reported people count for hours where no people count was reported. This prevents gaps in the output data. The combine function is only necessary when the room has multiple devices reporting people count and we want to combine their outputs. It will combine the hourly people counts from all the devices in the room into a single count per hour. We use the "max" method of combination to select the count from the device that saw the most people.
Equivalent shorthand: combine(max(device, true), "max")
Example 6: Total people count in an office every hour
combine(agg(spaces, "max", true), "sum")
Here, spaces is a data source containing each space in the office, restricted to the “People Count” sensor type. Set resolution to “Hour”. This example assumes that the office is divided into non-overlapping spaces with a single people count sensor each.
Explanation: The agg function with the "max" method will determine the maximum people count reported for each space in the office during each hourly interval. The true argument enables the fillna option, which fills in the last reported people count for hours where no people count was reported. This prevents gaps in the output data. The combine function will combine the hourly people counts for all the spaces in the office into a single count per hour. We use the "sum" method of combination to get the total count across all the spaces.
Equivalent shorthand: combine(max(device, true), "sum")
Example 7: Presence in a space every five minutes
combine(agg(space, "max", true), "max")
Here, space is a data source containing your space, restricted to the “Object is present” and “Motion detected” sensor types. Set resolution to “Five Minutes”.
Explanation: The agg function with the "max" method will determine whether a positive presence (1) was reported for each device in the space during each five-minute interval, because the devices report a value of 1 for presence and 0 for no presence. The true argument enables the fillna option, which fills in the last reported presence value for intervals where no presence value was reported. This prevents gaps in the output data. The combine function is only necessary when the space has multiple devices reporting presence and we want to combine their outputs. We want the final output to report a presence whenever at least one of the devices reports a presence. We can achieve this by using the "max" method of combination.
Equivalent shorthand: combine(max(space, true), "max")
Example 8: Seconds of presence reported by device each day
agg(device, "sum", true)
Here, device is a data source containing your physical device, restricted to the “Object is present” and “Motion detected” sensor types. Set resolution to “Day”.
Explanation: The agg function with the "sum" method and fillna set to true will fill in every second with the last presence reading (0 or 1) and sum them for each day, giving the daily number of seconds of presence.
Equivalent shorthand: sum(device, true)
Bonus tip: You can also compute this for a people count sensor by replacing device with device > 0. This will convert people count values greater than zero into ones, allowing the sum to be performed correctly.
Example 9: Average power usage per weekday
reduce(device, "avg")
Here, device is a data source containing your physical device, restricted to the “Electric power gauge” sensor type. Set resolution to “Day”.
Explanation: The reduce function with the "avg" method will divide the data into weeks (the next resolution up from "Day") and then compute the average power usage for each day of the week across all weeks in the selected time period.
Example 10: Maximum total people count in office per hour of day
reduce(combine(agg(spaces, "max", true), "sum"), "max")
This is an extension of Example 6. We take the hourly total office people count time series from Example 6 and use reduce to compute the maximum counts per hour of the day across all days.
Explanation: The first argument to reduce is simply the query for the total office people count from Example 6: combine(agg(spaces, "max", true), "sum") . The reduce function with the "max" method will then divide this data into days (the next resolution up from "Hour") and compute the maximum people count for each hour of the day across all days in the selected time period.
Example 11: Combining multiple data sources
combine([combine(agg(climate_devices, "avg"), "avg"), combine(agg(presence_devices, "max", true), "max")], "auto")
Here, climate_devices is a data source containing devices reporting indoor climate data, restricted to the relevant sensor types (e.g. “Temperature”, “CO2” and “Humidity”). Similarly, presence_devices is a data source containing devices reporting presence, restricted to the “Object is present” and “Motion detected” sensor types.
Explanation: This query is effectively a combination of two separate queries, one for indoor climate devices - combine(agg(climate_devices, "avg"), "avg") - and one for presence devices - combine(agg(presence_devices, "max", true), "max"). The two groups of devices have been put in different data sources because their data has to be processed differently. Continuous and regular data like that produced by indoor climate devices should typically be averaged, both in time (agg) and across devices (combine). Discrete and irregular data like presence data typically has to be filled in with previous values and have the max value being selected among the devices at each time. To get the output of both queries in a single query, we put the queries in a list and give the list as an argument to combine: combine([<query1>, <query2>], "auto"). Since the two queries have no sensor types in common, the outer combine will not modify the data, it will just group the outputs under a single new device. The combination method thus doesn’t matter, so we arbitrarily set it to "auto".
“Save a report” - Bookmark it ⭐
A little “Save a Playground report” hack
Since the URL is unique for the Query, you can just copy the URL or bookmark the report in your browser and you have access to the report any time as long as you are logged into https://app.neowit.io/